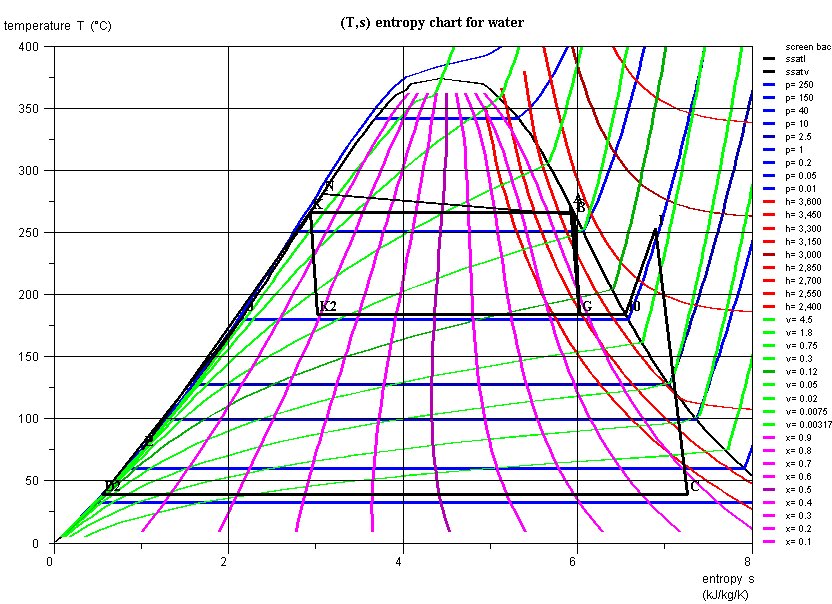
The interactive charts have been developed with a view to replace classical paper thermodynamic charts. Indeed, whatever care is taken by editors in the choice of color sets for distinguishing the various curves shown on the classical charts, it is always difficult to read them, and interpolation may lead to significant errors.
Thermoptim charts allow one, by a simple mouse click, to display all relevant thermodynamic properties of the fluid, thus providing better accuracy.
Their main asset is to be very easy to use: the thermodynamic properties are immediately displayed on the screen, a user-friendly point editor allows the user to refine his/her cycle analysis and to export the values in spreadsheets or text editors.

PWR cycle in the entropy chart
For vapors, the following charts are available (depending on the substance):
- (h, log (P)) chart
- entropy (T,s) chart
- (P,v) Clapeyron chart, for water only
- Mollier (h,s) chart
- exergy enthalpy chart (h,xh) or (h,ex)
- exergy entropy (s,xh) or (s,ex) chart
For ideal gases, the following charts are available:
- (h, log (P)) chart
- entropy (T,s) chart
- (P,v) Clapeyron chart
For moist gases, mixtures of dry gas and water, the following charts are available:
- Carrier chart
- Mollier chart


